


The fastest way to cut voice-agent latency is to stream every stage and let them overlap instead of running in sequence. That single architectural shift, combined with disciplined endpointing and a tighter model pipeline, is what separates agents stuck at 1,500ms from ones that feel human. Target P50 under 500 milliseconds and P95 under 800 milliseconds; sub-400ms territory generally requires a speech-to-speech model rather than a cascaded stack. The main levers to reduce latency are, in priority order: tuning endpointing thresholds, implementing streaming and overlapping pipeline stages, then optimizing models and prompt design.
TL;DR:
- Streaming and overlapping pipeline stages can significantly cut total voice latency, enabling a P50 under 500ms and a P95 below 800ms.
- Precise measurement of each stage’s latency percentile and resource usage is essential, with per-turn tracking and region-specific testing informing effective optimizations.
- Switching from batch to streaming STT, tuning endpointing thresholds carefully, and prewarming session connections are key to reducing individual stage delays.
- Optimizing the LLM with prompt trimming, model benchmarking, quantization, and token streaming can cut response times for short transactional queries.
- Co-locating services regionally, choosing suitable codecs, and implementing adaptive bitrate management mitigate network-induced delays and improve overall experience.
Table of Contents
- What Does Voice Latency Optimization Actually Mean?
- How Do You Build a Latency Budget for Your Pipeline?
- Instrumenting and Measuring Per-Stage Latency
- STT: Streaming, Endpointing, and Transport Choices
- LLM: Cutting Time-to-First-Token
- TTS: Streaming Audio Without Sacrificing Voice Quality
- Orchestration: Making Stages Overlap Instead of Queue
- Network and Deployment: Where Geography Costs You Milliseconds
- Reproducible Testing Plan and Benchmark Targets
- Prioritized Checklist to Reduce Latency
- Adaptive Bitrate and Dynamic Codec Selection
- CPU and GPU Resource Allocation for Lower Latency
- Real-Time Monitoring and Alerting for Latency Spikes
- Model Size, Complexity, and the Latency Trade-Off
- Error Handling and Fallback to Avoid Latency Spikes
- What Actually Trips Teams Up in Production
- How Monobot Helps You Measure and Cut Voice Latency
- Sources
- FAQ
What Does Voice Latency Optimization Actually Mean?
Voice latency optimization is the practice of reducing the time between when a caller stops talking and when they hear the agent’s response, known as time-to-first-audio (TTFA). It’s the metric that determines whether a voice agent feels conversational or feels like talking into a delayed radio channel.
Everything else, including low latency voice AI architecture, transport tuning, and model selection, exists to shrink that one number. Get TTFA right and callers stop noticing the technology. Get it wrong and no amount of conversational polish saves the experience.
Ideal, acceptable, and broken bands look like this:
- Ideal (P50 300–500ms): Feels like a real conversation; overlapping speech and quick backchannels work naturally.
- Acceptable (P50 500–800ms): Noticeable but tolerable, similar to a slightly laggy phone connection.
- Broken (P95/P99 above 1,200ms): Callers start talking over the agent or hang up, since engineering benchmarks for voice AI show user experience degrades sharply past that point.
Percentile reporting matters more than averages here. A P50 of 450ms sounds great until you learn the P99 is 2.1 seconds, meaning one in a hundred calls feels broken. Report P50, P95, and P99 side by side, because the worst 5% of interactions are usually where churn and complaints originate, not the median.
How Do You Build a Latency Budget for Your Pipeline?
Start by measuring your current baseline before touching any code. Instrument the full round trip, from the moment a caller stops speaking to the moment audio starts playing back, and log it across at least 200 real or synthetic turns. You cannot optimize what you have not measured, and teams frequently discover their bottleneck is not where they assumed.
Once you have a baseline, pick a TTFA target based on the agent’s job. A conversational agent handling open-ended support queries can tolerate 700 to 800ms because the dialogue itself has natural pauses. A transactional agent confirming an order or processing a payment needs to feel snappier, closer to 500ms, because the interaction is short and any lag reads as a system failure rather than thoughtful pausing.
Allocate your budget stage by stage once you have a target. A workable 600ms budget for a conversational agent might look like this:
- Endpointing (silence detection): 300–400ms
- STT finalization: 50–100ms
- LLM time-to-first-token: 150–250ms
- TTS time-to-first-byte: under 200ms
- Network and jitter buffer: 30–80ms
Those numbers won’t add up cleanly to your total target, which is the point: streaming lets stages overlap so the LLM starts generating while STT is still finalizing, and TTS starts speaking before the LLM has finished its sentence. Sequential math and real-world math diverge on purpose.
Endpointing deserves special attention because it’s the most controllable lever and the easiest to get wrong. Lowering your silence threshold from 500ms to 300ms shaves real time off every single turn, but it also raises your interruption rate, the percentage of turns where the agent cuts in before the caller finished a thought. Track that rate alongside your latency numbers. If interruptions climb above a few percent, you’ve traded speed for a worse experience, not a better one.
Instrumenting and Measuring Per-Stage Latency
You cannot fix what you cannot see, and voice pipelines hide their worst behavior inside averages. The fix is per-stage tracing: wrap every component (STT, LLM, TTS, endpointing, network transport) in its own span using an OpenTelemetry-style tracing model, so each turn produces a waterfall you can inspect after the fact rather than a single opaque number.
Capture three timestamps at minimum for every turn: time-to-first-token from the LLM, time-to-first-byte from TTS, and time-to-first-audio at the client. LiveKit’s engineering guidance on agent observability recommends tagging every span with session attributes, meaning caller region, model version, and voice selection, so that when a regression appears you can filter by dimension instead of re-running the whole test suite blind.
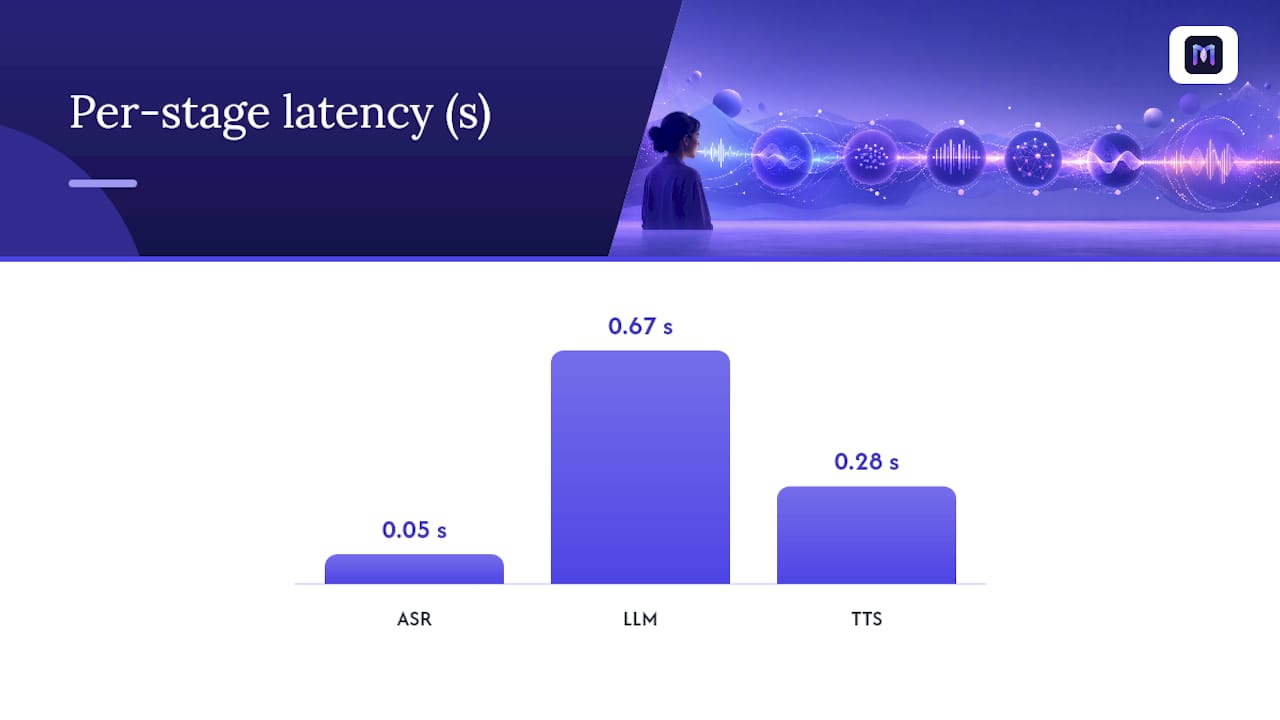
Statistic Callout: In one published end-to-end pipeline combining streaming ASR, a quantized LLM, and streaming TTS, the average total latency per utterance came in at 0.94 seconds, with ASR contributing roughly 0.05s, the LLM 0.67s, and TTS 0.28s, run concurrently rather than added in sequence.
That kind of per-stage breakdown is exactly what your own instrumentation should output. Once you have spans, report the numbers as percentiles, not averages:
- P50: your typical caller experience, useful for setting expectations with stakeholders.
- P95: the number that predicts frustrated callers and should drive most optimization work.
- P99: the tail that reveals infrastructure problems, cold starts, or regional network issues hiding in your worst 1% of calls.
Run two categories of tests. Synthetic load tests replay recorded audio at scale to catch regressions before deployment and to stress-test concurrency limits. Production traces, sampled continuously from live calls, catch the drift synthetic tests miss, like a specific carrier route adding 200ms or a model provider’s API degrading during peak hours.
If you self-host any component, add GPU utilization and memory pressure to your dashboards alongside latency. Correlating resource metrics with latency spikes early saves a painful debugging session later.
Pro Tip: Tag every trace with a call ID that persists across STT, LLM, and TTS spans. When a customer complains about a specific call, you want to pull the full waterfall in seconds, not reconstruct it from three separate logging systems.
STT: Streaming, Endpointing, and Transport Choices
Batch transcription, where you wait for a caller to finish talking, send the full audio clip, and wait for a complete transcript, is the single most common reason cascaded voice pipelines feel sluggish. Streaming STT eliminates that dead time by sending partial transcripts as words are recognized, which lets downstream stages start working before the caller has even finished their sentence.
The practical move is to feed those partial transcripts to your LLM the moment intent confidence crosses a threshold, rather than waiting for the STT engine to mark the utterance final. This is the core mechanism behind reports of hundreds of milliseconds saved on P95 latency simply by switching from batch to streaming transcription.
Endpointing sits right next to STT in the latency budget and deserves its own tuning cycle, separate from your model choices. A pure silence-based voice activity detector (VAD) has to guess when someone has actually finished talking versus just pausing to think. Production practice converges on a 300 to 500 millisecond silence floor for most conversational agents, since many frameworks default to a more conservative 500 to 800ms out of the box.
Semantic endpointing improves on pure silence detection by factoring in whether the sentence sounds grammatically complete, not just whether the caller stopped making sound. This lets you lower your silence threshold without triggering more false-start interruptions, because the system has an additional signal beyond raw quiet time.
What to change, in order of effort:
- Switch batch STT calls to a streaming API if your current provider supports it.
- Lower silence threshold incrementally from any default above 500ms, watching interruption rate at each step.
- Layer in semantic endpointing if your STT or orchestration layer offers it.
- Move to WebRTC or a persistent gRPC stream instead of repeated HTTP requests, since a fresh TLS handshake on every turn adds fixed overhead that streaming transport avoids entirely.
Pro Tip: *Measure interruption rate as a percentage of turns, not raw count.
LLM: Cutting Time-to-First-Token
The LLM stage is usually the largest single chunk of your latency budget, and it’s also where the most levers exist. Time-to-first-token (TTFT), not total generation time, is what determines perceived speed in a streaming pipeline, because TTS can start speaking the moment the first few tokens arrive.
Prompt structure is the cheapest fix available. Keep your system prompt small, stable, and identical across turns within a session. Providers that support prefix caching reuse the computation for any prompt prefix that hasn’t changed, which means a bloated, constantly-shifting system prompt throws away that optimization on every single turn. A lean, consistent prompt lets prefix caching do real work instead of starting from scratch each time.
Model selection matters as much as prompt design. Not every model streams tokens at the same rate, and benchmarking TTFT specifically, not just overall throughput, should be part of your model evaluation before you commit to a provider. MLCommons’ MLPerf inference benchmarks offer a useful comparative baseline across hardware and model families when you’re deciding between options, though your own TTFT numbers under real conversational load will differ from any published benchmark.
For short, transactional turns, running a smaller model can outperform a larger one on latency without a noticeable quality gap, since the response itself, “your order ships tomorrow,” doesn’t need the reasoning depth a longer support conversation might.
Statistic Callout: In a self-hosted pipeline combining streaming ASR with a 4-bit quantized LLM, the LLM stage averaged 0.67 seconds even while running concurrently with retrieval-augmented generation, a meaningful reduction attributable in part to quantization’s effect on inference speed and memory footprint.
Quantization deserves a permanent place in your optimization checklist if you self-host any model in the pipeline. Reducing weights to 4-bit precision after training cuts inference latency and GPU memory demand with a quality tradeoff that’s often smaller than teams expect, particularly for the shorter, more constrained responses typical of voice agents versus open-ended chat.
Concrete LLM-stage moves:
- Trim and stabilize the system prompt to maximize prefix cache hits.
- Benchmark TTFT explicitly, separate from total response time, for every candidate model.
- Route short transactional turns to a smaller model and reserve larger models for complex, open-ended dialogue.
- Apply 4-bit quantization to self-hosted models and re-measure both latency and output quality before rolling it out broadly.
- Stream tokens to TTS the moment a clause boundary appears, rather than waiting for full-sentence completion.
TTS: Streaming Audio Without Sacrificing Voice Quality
TTS is the stage where teams most often trade away latency gains they earned upstream, usually by waiting for a complete sentence before synthesizing any audio. Streaming TTS by clause, starting playback the instant the first audio chunk is ready, is what actually delivers on the overlap architecture, since the caller hears speech while the LLM is still generating the rest of the response.
Target under 200 milliseconds for TTS time-to-first-byte if you want the audio-start delay to disappear into the natural rhythm of conversation. Anything slower than that becomes audible as a hesitation, even when the rest of your pipeline is fast.
Voice selection carries a real latency cost that’s easy to overlook. Higher-fidelity, more expressive voices generally require more synthesis time per chunk than faster, simpler voice options. For transactional flows, appointment confirmations, order status, PIN verification, a quicker voice with slightly less naturalness usually beats a beautiful voice with an audible delay before every response. Save your premium voice tier for flows where the brand experience genuinely benefits from it. If you’re still evaluating voice options generally, primers on generating natural AI voiceovers cover the tradeoffs between synthesis quality and speed at a foundational level.
Codec choice needs to match your transport layer rather than default to whatever your TTS provider ships. A codec mismatch forces transcoding somewhere in the pipeline, and every transcoding step adds latency that has nothing to do with your model or your network, just wasted CPU cycles converting formats.
Player buffer size is the last lever, and it’s the one teams tune too conservatively out of habit. A large buffer protects against jitter but adds fixed delay to every response regardless of whether that protection was ever needed. Pull real jitter measurements from your transport layer, using the W3C WebRTC Stats metrics for round-trip time and jitter, and size your buffer to that measured reality rather than a defensive guess.
Orchestration: Making Stages Overlap Instead of Queue
Sequential pipelines are the default architecture and the default latency problem. STT waits for silence, then LLM waits for the full transcript, then TTS waits for the full response. Each wait is small, but they stack additively into the 1,500ms-plus latency that makes agents feel robotic.
The fix is a producer-consumer pattern at the sentence level. As the LLM generates punctuated sentence chunks, it pushes each one into a thread-safe queue immediately, and a TTS consumer picks up chunks and synthesizes them as they arrive, rather than waiting for the model to finish its full response. This lets TTS run in parallel with later token generation instead of strictly after it, which is where a meaningful chunk of the overlap savings actually comes from.
Speculative execution extends the same idea upstream. When an STT partial reaches high intent confidence, meaning the system is fairly sure it knows what the caller is asking before they’ve finished the sentence, you can prefetch the tool call or database lookup that response will likely need. Cancel it cleanly if the final transcript diverges from the prediction. This costs occasional wasted API calls but removes tool-call latency from the visible critical path most of the time.
Cold starts quietly undermine every optimization above if session initialization isn’t warmed. A first turn that has to establish a fresh DNS lookup, spin up a cold LLM connection, and run a first-ever TTS synthesis will lag noticeably behind every turn after it. Warmup routines, meaning a primer LLM call and a dummy TTS synthesis fired the moment a session opens, absorb that penalty before the caller ever says a word.
Orchestration priorities:
- Replace blocking sequential calls with a sentence-level producer-consumer queue between LLM and TTS.
- Prefetch tool calls on high-confidence STT partials and build a clean cancellation path for divergence.
- Warm connections and run a dummy synthesis at session start to eliminate cold-start penalties from the first turn.
Pro Tip: *Log how often prefetched tool calls get canceled versus used.
Network and Deployment: Where Geography Costs You Milliseconds
Every hop your audio and data take between caller, gateway, STT, LLM, and TTS adds latency that has nothing to do with model quality. Co-locating your voice gateway, STT engine, and TTS engine in the same region as your caller base removes a category of delay that no amount of prompt engineering fixes.
LLM region placement deserves the same scrutiny, especially if you’re relying on prefix caching. Pinning your LLM calls to a single region keeps that cache warm and consistent; bouncing requests across regions for load-balancing reasons can quietly defeat the caching benefit you engineered upstream.
Transport protocol choice matters more than most teams assume. SIP or WebRTC connections generally introduce fewer carrier hops than routing through the traditional PSTN, and each avoided hop is milliseconds you don’t have to claw back somewhere else in the pipeline.
Don’t guess at regional performance. Run your latency tests region by region using real or simulated traffic from each geography you serve, then prioritize infrastructure spend on whichever region carries your highest call volume. A perfectly optimized pipeline serving the wrong region first is still a slow experience for most of your callers.
Deployment checklist:
- Co-locate gateway, STT, and TTS services in the same region as your primary caller base.
- Pin LLM requests to one region to preserve prefix cache warmth.
- Choose SIP or WebRTC over PSTN wherever your telephony provider supports it.
- Benchmark latency separately per region and rank infrastructure investment by call volume.
Reproducible Testing Plan and Benchmark Targets
A latency number you can’t reproduce is a latency number you can’t trust. Build your test plan around two datasets: a synthetic set of scripted, recorded audio you can replay identically across every code change, and a real multi-turn dataset pulled from anonymized production calls that captures the messiness actual callers bring, interruptions, background noise, mid-sentence topic changes.
- Establish a cold-start and warm-start baseline by running the same test set twice, once against a freshly initialized session and once against a warmed connection, to isolate cold-start penalties from steady-state performance.
- Run the synthetic set at scale to catch regressions before every deployment, tracking P50, P95, and P99 TTFA alongside per-stage breakdowns for STT, LLM, and TTS.
- Replay real multi-turn traces weekly against the current production pipeline to catch drift that synthetic tests miss, like a carrier route change or a model provider’s API slowing during peak hours.
- Log resource usage alongside latency so a GPU or memory ceiling shows up as a correlated metric rather than a mystery spike discovered separately.
- Set regression alerts on percentile shifts, not just averages, since a P99 that doubles while P50 stays flat is exactly the kind of tail problem averages hide.
These bands align with practical voice AI latency targets published by engineering teams and should adjust based on whether your agent is conversational or transactional, per the budget guidance earlier.
Prioritized Checklist to Reduce Latency
Not every fix costs the same. Work through these roughly in order, since the earlier items deliver the largest latency reduction for the least engineering effort.
- Tune your endpointing threshold down from any default above 500ms, watching interruption rate at each step, since this is usually the single fastest win available.
- Switch STT to streaming if it isn’t already, and feed partial transcripts downstream on high intent confidence.
- Warm TTS and LLM connections at session start to eliminate first-turn cold-start penalties.
- Trim and stabilize your system prompt to unlock prefix caching on every subsequent turn.
- Restructure LLM-to-TTS as a sentence-level queue rather than a blocking, wait-for-completion call.
- Prefetch high-confidence tool calls and build cancellation logic for when predictions diverge.
- Quantize self-hosted models to 4-bit and re-benchmark both latency and quality before full rollout.
- Co-locate services regionally and pin LLM calls to preserve cache warmth.
- Evaluate speech-to-speech models only after the cascaded stack above is fully optimized, since S2S is a bigger architectural bet, not a quick win.
Pro Tip: Ship changes one at a time through canary traffic, not all at once. If you tune endpointing and switch models in the same deployment, a latency regression leaves you with no idea which change caused it.
Adaptive Bitrate and Dynamic Codec Selection
Network conditions change mid-call more often than teams account for, and a fixed bitrate that works fine on solid Wi-Fi turns into stutter and dropped packets the moment a caller’s connection degrades. Adaptive bitrate adjusts audio quality in real time based on measured network conditions, trading a small amount of audio fidelity for a stable, low-latency stream when bandwidth tightens.
The mechanism relies on the same transport metrics covered earlier: round-trip time, jitter, and packet loss, pulled from WebRTC’s stats interface. When jitter climbs or packet loss crosses a threshold, the pipeline should downshift to a lower bitrate codec automatically rather than continuing to push high-fidelity audio into a connection that can’t carry it cleanly.
Dynamic codec selection extends this further by choosing between codec options based on measured conditions rather than committing to one codec for every call. A caller on a strong broadband connection can use a richer codec with more natural voice quality. A caller on a spotty cellular connection needs a codec built for resilience over fidelity, even if it sounds slightly more compressed.
The practical implementation runs a lightweight monitor loop, sampling transport stats every few seconds during a call and adjusting bitrate or codec when thresholds are crossed. Set the adjustment thresholds conservatively enough that you’re not thrashing between quality levels on minor jitter fluctuations, since flapping between codecs mid-sentence is its own kind of jarring experience.
The tradeoff is worth naming plainly: adaptive systems add a small amount of monitoring overhead and occasional audible quality shifts in exchange for far fewer dropped calls and latency spikes when network conditions genuinely degrade. For most production voice agents serving callers on mixed connection quality, that tradeoff favors adaptation.
CPU and GPU Resource Allocation for Lower Latency
Hardware allocation decisions made months before launch quietly cap your latency ceiling long after your software optimizations are done. A model running on a shared, oversubscribed GPU will show fine latency numbers during light load testing and then degrade badly the moment concurrent call volume climbs, because it’s competing for compute it doesn’t have reserved.
Reserve dedicated GPU capacity for latency-sensitive inference stages, particularly self-hosted LLM and TTS models, rather than sharing hardware across unrelated workloads that can spike unpredictably. If you’re running inference on shared infrastructure, correlate GPU utilization directly with your latency dashboards, since a utilization spike that coincides with a latency spike tells you exactly where to add capacity.
CPU allocation matters more than teams expect for the orchestration layer itself, not just the model inference. The threading and queue management behind a producer-consumer TTS pipeline, described earlier, needs enough CPU headroom to avoid becoming its own bottleneck, especially when handling dozens of concurrent calls each running their own sentence queue.
Hardware acceleration options vary by workload. Quantized models, covered earlier for their latency benefits, pair naturally with GPU acceleration since lower-precision math runs faster on modern accelerator hardware than full-precision inference. For teams evaluating hardware and model combinations, MLPerf’s published inference benchmarks offer a comparative baseline across hardware families, though your own concurrent-load numbers will diverge from any published single-model benchmark.
The general rule: provision for your P95 concurrent load, not your average load, since a hardware allocation sized for typical traffic will be exactly the thing that fails during your busiest hour.
Real-Time Monitoring and Alerting for Latency Spikes
A latency regression that surfaces first in a customer complaint has already cost you calls, reputation, and debugging time you didn’t need to spend. Real-time monitoring closes that gap by surfacing percentile shifts the moment they happen, using the per-stage tracing infrastructure covered earlier in the instrumentation section.
Set alert thresholds on percentile movement, not absolute values alone. A P95 that jumps from 700ms to 1,100ms in an hour is a meaningful signal even if it hasn’t crossed some fixed “bad” number yet, and catching that shift early often means catching a bad deployment or a degraded upstream provider before it affects most of your call volume.
Dashboard granularity matters here. An aggregate latency chart across your entire call volume hides regional and provider-specific problems. Break your monitoring down by region, by model version, and by voice selection, so a spike caused by one specific combination doesn’t get diluted into invisibility inside a global average. Tools like Monobot’s dashboard analytics are built around exactly this kind of per-turn, per-dimension breakdown, letting teams catch a regional or model-specific spike without manually cross-referencing separate logging systems.
Alert fatigue is the failure mode that kills monitoring programs quietly. If every minor fluctuation triggers a page, teams start ignoring alerts entirely, which means the one alert that mattered gets missed along with the noise. Tune thresholds against your own historical variance, not a generic industry number, and reserve paging alerts for percentile shifts that persist across multiple consecutive measurement windows rather than single-sample blips.
Model Size, Complexity, and the Latency Trade-Off
Bigger models generally reason better and handle ambiguous, open-ended queries with more nuance. They also generate tokens more slowly, which directly inflates time-to-first-token and, by extension, every downstream stage waiting on those tokens. This trade-off is the crux of most LLM-stage latency decisions covered earlier, and it deserves a closer look on its own terms.
The relationship isn’t perfectly linear. A model twice the parameter count doesn’t necessarily run twice as slow, since architecture, quantization, and serving infrastructure all shape actual throughput independent of raw parameter count. This is exactly why benchmarking your actual candidate models on your actual infrastructure matters more than reasoning from parameter counts alone.
Task complexity should drive model selection more than a blanket “always use the biggest model” policy. A caller asking to confirm a delivery address needs a model that can extract an address and confirm it, not one built to reason through multi-step logical problems. Routing simple, well-defined turns to a smaller, faster model and reserving larger models for genuinely open-ended or ambiguous queries lets you hit better latency on the majority of turns without sacrificing capability where it’s actually needed.
The quantization angle, covered in the LLM section, interacts directly with this trade-off. A quantized version of a larger model can sometimes deliver both better reasoning than a smaller full-precision model and faster inference than the same model at full precision, which is why the end-to-end pipeline benchmarks cited earlier paired a quantized model with concurrent execution rather than simply choosing the smallest available model outright. Test both axes, size and precision, before assuming one lever alone solves your latency budget.
Error Handling and Fallback to Avoid Latency Spikes
Failures in a voice pipeline don’t just break functionality, they often manifest as latency spikes long before they manifest as an outright error, because a struggling API tends to slow down before it fails completely. A timeout strategy that waits too long to give up on a slow upstream call turns a minor provider hiccup into a multi-second dead-air moment for the caller.
Set aggressive timeouts on every external call in the pipeline, STT, LLM, TTS, and tool calls alike, tuned tighter than your overall latency budget allows for that stage. A timeout set at exactly your target latency gives you zero room to fail over gracefully; a timeout set meaningfully tighter than your target leaves room to retry or fall back before the caller notices anything wrong.
Fallback paths need to be pre-built, not improvised at failure time. If your primary TTS provider times out, a fallback to a secondary voice provider, even one with a less ideal voice, beats dead air every time. If your primary LLM call fails or exceeds its timeout, a pre-scripted fallback response, “Let me get that information for you,” bought while a retry runs in the background, keeps the interaction moving instead of leaving silence.
Circuit breaker patterns prevent a struggling upstream service from dragging down every subsequent call. Once a provider’s failure or timeout rate crosses a threshold within a rolling window, route new calls to a fallback path automatically rather than letting each new session discover the same failure independently and eat the same timeout penalty.
The caveat that applies equally here as it does to endpointing thresholds: any fallback that trades response quality for speed needs monitoring on the acceptance side too. A fallback response that resolves calls faster but frustrates callers into escalating anyway hasn’t actually fixed the problem, just moved where it shows up.
What Actually Trips Teams Up in Production
Most latency failures I see trace back to one root cause: a pipeline built sequentially and optimized stage by stage without ever testing the whole thing under real concurrent load. Teams shave 50ms off STT, declare victory, then discover the LLM and TTS stages were never actually overlapping in production the way they were in a demo. Averages hide this. P95 and P99 expose it.
The endpointing trade-off deserves more respect than it gets. Every team wants a lower silence threshold until they see interruption rate climb, and then they want the safety back until latency complaints return. There’s no universal right answer here, only a right answer for your specific caller base and use case, which means this number needs revisiting quarterly, not set once at launch and forgotten.
Sometimes the correct move is trading latency for accuracy deliberately, particularly in regulated or high-stakes flows like payment confirmation, where a slightly slower, more careful verification beats a fast one that occasionally gets it wrong. Speed is a means, not the goal.
Roll out any latency change through canary traffic with explicit rollback criteria set before you deploy, not decided in a panic after a spike. If P95 crosses your threshold for more than a few minutes, roll back automatically rather than debating it live.
— Alex
How Monobot Helps You Measure and Cut Voice Latency
Monobot is built for teams who need latency data now, not after weeks of custom instrumentation work. The platform’s dashboard analytics give you per-turn breakdowns out of the box, showing exactly where a call spent its time across recognition, response generation, and playback, without you standing up your own OpenTelemetry pipeline from scratch.
If you’re deciding whether streaming and overlap architecture is worth the engineering lift described throughout this guide, running a pilot inside Monobot’s AI agent builder gives you a fast way to test it. Configure a flow, connect live transcription for streaming STT, and watch how endpointing and voice settings shift your measured baseline before you commit to building any of this in-house. For teams already running voice deployments, voice analytics surfaces the call-level detail you’d otherwise need custom tracing to see.
Start a pilot, point it at a real workload, and check your first-week dashboard against the P50 and P95 targets covered in this guide. That comparison alone tells you more about your latency ceiling than another round of manual instrumentation would.
Sources
A short list of references pulls real weight when you’re actually building this, beyond general advice. The W3C WebRTC Stats specification defines the exact transport metrics, RTT, jitter, packet loss, you need for buffer and codec tuning. MLCommons’ MLPerf inference results give you a comparative hardware and model baseline before you commit to a self-hosted stack. The arXiv paper on end-to-end low-latency voice pipelines documents the quantization and concurrency techniques in enough technical detail to replicate. LiveKit’s engineering guidance on agent latency and Speko’s sub-500ms playbook both translate the theory into production-tested defaults.
- End-to-end low-latency voice-to-voice pipeline (arXiv)
- WebRTC Stats (W3C)
- Understand and improve agent latency (LiveKit blog)
FAQ
How Can I Improve Audio Latency in a Voice Agent?
Stream every pipeline stage, meaning STT partials, LLM tokens, and TTS chunks, instead of waiting for each to fully finish before the next one starts, and tune your endpointing threshold down to the lowest level your interruption rate tolerates.
What Is Voice Latency?
Voice latency is the delay between when a caller finishes speaking and when they hear the agent’s response, typically measured as time-to-first-audio (TTFA) across the recognition, reasoning, and speech synthesis stages.
What Is Considered Acceptable Latency for Voice Calls?
A P50 under 500 milliseconds and P95 under 800 milliseconds is a solid target for most conversational voice agents, while latency above roughly 1,200 milliseconds tends to degrade user experience sharply.
What Is a Good Latency for Audio in a Streaming Pipeline?
For TTS specifically, time-to-first-byte under 200 milliseconds keeps the audio start feeling immediate rather than hesitant, and combined with streaming STT and LLM stages, that supports the sub-800ms end-to-end targets covered throughout this guide.
Does Reducing Endpointing Delay Always Help Latency?
Lowering your silence threshold reduces latency but raises interruption risk, so production teams typically converge on a 300 to 500 millisecond floor rather than pushing it as low as technically possible.