


Track six numbers before anything else: containment rate, goal completion rate (GCR), CSAT, intent accuracy, escalation rate, and cost per conversation. Baseline each one this week and put them on a single dashboard. Everything else in chatbot analytics, from fallback rates to sentiment scoring, exists to explain why those six moved. The formulas, benchmarks, and fixes for each one follow below.
TL;DR:
- Tracking containment and goal completion rates is essential to determine whether the bot effectively resolves conversations without human intervention.
- Leading indicators like fallback rate and intent accuracy provide real-time warnings that allow teams to fix issues before customer satisfaction declines.
- Combining metrics segmented by channel and intent ensures accurate diagnosis and prevents misleading averages that hide underlying problems.
- Prioritizing knowledge health metrics, such as intent accuracy and fallback rate, helps maintain long-term bot understanding and protects ROI.
- Regularly reviewing a unified dashboard that includes efficiency, quality, and knowledge metrics supports faster, more targeted improvements.
Table of Contents
- What Are Chatbot Analytics Metrics, and Why Do They Matter for ROI?
- Why Measure Leading vs. Lagging Indicators First?
- Core Chatbot Performance Metrics, Category by Category
- How to Measure Chatbot Performance: Formulas, Dashboards, and Benchmarks
- Choosing Your 4 to 6 KPIs and Running a 30/60/90 Plan
- Turning Metrics Into Fixes: Experiments and Measurement Hygiene
- How Monobot Turns These Metrics Into a Working Dashboard
- Why Knowledge Health Should Lead Every KPI Program
- Put These Metrics on One Dashboard With Monobot
- Sources
- FAQ
What Are Chatbot Analytics Metrics, and Why Do They Matter for ROI?
Chatbot analytics metrics are the measurements pulled from conversation logs, natural language processing (NLP) performance, routing and handoff events, and outcome signals like conversions or resolved tickets. Together they answer three separate questions: is the bot handling volume efficiently, is it doing that well, and does it actually understand what customers are asking. Treating those as one blended “performance” score is the fastest way to miss a real problem.
It helps to sort every metric you’ll encounter into three diagnostic buckets:
- Efficiency — volume handled, containment, average handle time, cost per conversation
- Quality — CSAT, sentiment, first contact resolution
- Knowledge health — intent accuracy, fallback rate, missed utterances
Efficiency gains without quality and knowledge health checks are fragile. A bot can post a rising containment rate for months while quietly misclassifying a growing share of intents, and nobody notices until CSAT craters. That sequence is common enough that it deserves its own section below.
The ROI case for measuring any of this comes down to a simple trade. Every conversation a chatbot resolves without a human is a conversation you didn’t pay an agent to handle, and a consolidated KPI set built around containment, cost per conversation, first contact resolution, CSAT, and escalation rate is the standard starting point finance teams expect to see. Deflection drives the savings side of the equation. CSAT drives retention. Miss either one and the ROI story falls apart, no matter how good the automation rate looks on paper.
Why Measure Leading vs. Lagging Indicators First?
CSAT and revenue impact are lagging indicators. They tell you what already happened, days or weeks after the conversation ended. Intent accuracy and fallback rate are leading indicators. They tell you what’s about to go wrong, often in real time, before a customer ever files a complaint or churns.
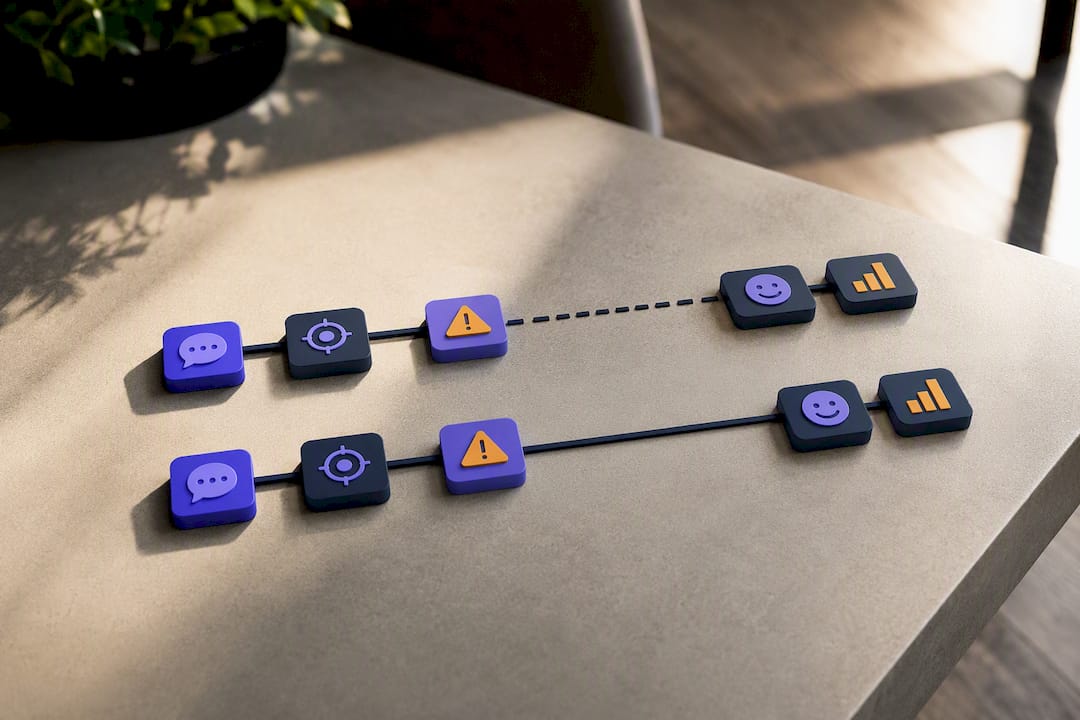
That distinction changes how you should spend your attention. If fallback rate climbs 3 points month over month, that’s a leading signal you can act on today. Wait for CSAT to drop before investigating, and you’re already several weeks and several thousand frustrated conversations behind. The diagnostic priority should always run the same direction: fix the leading indicators first, because a knowledge-health problem left unaddressed shows up downstream as a quality problem, and a quality problem left unaddressed shows up downstream as churn.
Three pitfalls trip up most teams building their first chatbot analytics dashboard:
- Chasing containment in isolation. A high deflection rate paired with a low goal completion rate usually means the bot is ending conversations, not resolving them.
- Averaging across channels and intents. A blended intent accuracy score of 88% can hide a billing intent sitting at 60% and a store-hours intent at 99%.
- Treating fallback rate as a static number. It should be tracked as a trend, segmented by intent, not a single dashboard tile that gets glanced at once a month.
Core Chatbot Performance Metrics, Category by Category
Comprehensive chatbot analytics break down into user, conversation, outcome, NLP-health, and commercial metrics, and each category answers a different operational question. Here’s what to track in each, and what the numbers actually mean when they move.
User metrics
Total interactions counts every conversation started in a given period. It’s a volume metric, not a health metric. A spike can mean a successful marketing push or a broken flow sending customers in circles, so never read it alone.
DAU/MAU (daily active users over monthly active users) measures stickiness.
Sessions per user flags repeat contact. If the same customer opens three sessions in a week for what should be a single issue, that’s a resolution problem wearing a volume mask.
Conversation metrics
Average chat duration cuts both ways. Too short can mean the bot is deflecting without resolving. Too long can mean it’s stuck in a fallback loop, asking the same clarifying question three different ways.
Messages per conversation is a rough proxy for conversational efficiency. A well-tuned bot for a simple task like order status should resolve in 3 to 5 exchanges. Ten or more is worth investigating.
Bounce and session completion rates show where customers give up. A bounce inside the first message usually points to a broken welcome flow or a mismatched entry point, not a language problem.
Outcome metrics
Goal completion rate (GCR) is the percentage of conversations that reach a defined success state, whether that’s a booked appointment, a resolved ticket, or a completed order lookup. GCR is the single best proxy for “did the bot actually help,” and it’s the metric containment rate alone can’t tell you.
Conversion rate applies when the bot has a commercial goal, like qualifying a lead or completing a purchase. Track it separately from GCR since a conversation can complete its stated goal without converting commercially.
Custom goal tracking lets you define success per use case: a password reset confirmed, a claim status delivered, an IT ticket auto-closed. Generic platforms miss these unless you instrument them explicitly.
NLP and knowledge-health metrics
Missed utterances are messages the bot couldn’t map to any known intent. A rising trend here is often the earliest warning sign in the entire dashboard, arriving weeks before CSAT reacts.

Fallback rate is the share of turns where the bot defaults to “I didn’t understand that” or a similar catch-all.
Intent accuracy measures how often the bot classifies the correct intent against a labeled sample. For large language model (LLM) based agents, raw accuracy numbers can be deceptive. Response accuracy and factuality genuinely require human-evaluated samples layered with automated checks, because a model can sound confident and still be wrong.
Confidence thresholds determine when the bot acts on its best guess versus routing to a human or asking for clarification. Set too low, and you get confidently wrong answers. Set too high, and you flood your escalation queue with easy questions the bot could have handled.
Quick benchmark check: Industry data pegs healthy chatbot CSAT between 70% and 80%, with scores above 85% considered excellent and anything under 70% a warning sign worth immediate attention.
Handoff and timing metrics
Human takeover rate tracks how often a live agent has to step in. Escalation rate is related but distinct: it measures how often the bot itself flags a conversation for handoff versus a customer forcing the issue by asking for a human directly. First response time and resolution time round out the timing picture, and both should be tracked separately for bot-only conversations versus conversations that escalate, since blending the two hides how much delay the handoff itself adds.
Experience metrics
CSAT is the most-cited quality signal in chatbot analytics, and for good reason: it’s the metric that correlates most directly with retention. Sentiment analysis adds a layer CSAT surveys miss, since most customers never fill out a post-chat rating. Scoring the emotional tone of the conversation itself catches frustration that would otherwise go unmeasured.
How to Measure Chatbot Performance: Formulas, Dashboards, and Benchmarks
Every metric above needs a source system and a formula before it means anything on a dashboard. Here’s the practical build order.
- Containment (deflection) rate = (Conversations resolved without human handoff ÷ Total conversations) × 100
- Goal completion rate = (Conversations reaching defined goal state ÷ Total conversations with that goal) × 100
- Fallback rate = (Fallback responses ÷ Total bot responses) × 100
- Intent accuracy = (Correctly classified intents ÷ Total labeled test utterances) × 100
- Cost per conversation = Total bot operating cost ÷ Total conversations handled
- ROI = (Deflected conversations × cost per human interaction) − Bot operating cost
That last formula is worth sitting with. If your bot deflects 8,000 conversations a month, your average human interaction costs $6, and the bot’s monthly operating cost is $2,500, you’re looking at roughly $45,500 in net monthly savings. Running that math in cost-per-conversation terms, rather than vague automation percentages, is what gets chatbot investment approved at the leadership level.
Data for these formulas comes from three places: conversation logs and event instrumentation inside the bot platform, webhook events fired to your CRM or ticketing system on resolution or escalation, and CSAT survey hooks triggered at conversation close. A dashboard that pulls from only one of these sources will always have blind spots, since good chatbot analytics tools combine performance, NLP accuracy, and conversion reporting in a single view rather than scattering them across separate tools.
Layout matters more than most teams assume. Put efficiency, quality, and cost metrics on the same screen, segmented by channel and by intent, not blended into one average.
| Metric | Healthy range | Warning threshold |
|---|---|---|
| CSAT | 70–80% (85%+ excellent) | Below 70% |
| Containment/deflection | 60–80%, industry dependent | Declining month over month |
| Fallback rate | Under 15% | Rising trend over 2+ months |
| Escalation rate | Stable or falling | CSAT gap vs. agents over 15 points |
Choosing Your 4 to 6 KPIs and Running a 30/60/90 Plan
Not every metric above belongs on your primary dashboard. Pick the four to six that map directly to what your organization is trying to accomplish, and judge each candidate against four criteria: does it align with a real business goal, can you measure it reliably today, will stakeholders actually trust the number, and can you act on it when it moves.
Different goals call for different KPI suites:
- Cost reduction → containment rate, cost per conversation, escalation rate
- Lead generation → conversion rate, GCR, cost per qualified lead
- Internal IT or HR support → resolution time, fallback rate, employee CSAT
A 30/60/90 day plan turns that selection into a working program. In the first 30 days, baseline every chosen KPI and get them onto one dashboard, segmented by intent and channel. In days 31 to 60, make quick fixes: adjust confidence thresholds, rewrite fallback messaging, fix flow branches causing early bounces. In days 61 to 90, move to structural changes: retrain intent models on the missed-utterance backlog and run A/B tests on welcome prompts or routing logic.
Pro Tip: If your chatbot CSAT trails live-agent CSAT by more than 15 points, check escalation routing before you touch the NLP model. Broken context handoff, where the bot fails to pass conversation history to the human agent, is a more common culprit than the bot’s actual language understanding.
Watch for two red flags in particular: a CSAT gap of more than 15 points against human agents, and a fallback rate that climbs steadily month over month rather than staying flat or trending down after a training update.
Turning Metrics Into Fixes: Experiments and Measurement Hygiene
Metrics only earn their place on a dashboard if they trigger action. Here’s the workflow that connects a number moving to a fix shipping.
- Run targeted experiments. Update the intents behind your top five fallback triggers, adjust confidence routing thresholds by small increments, and test two versions of your welcome prompt against each other for a week.
- Fix the taxonomy before the model. A messy event taxonomy, where “purchase confirmed” and “order placed” fire as separate events for the same action, will corrupt your GCR numbers regardless of how good the bot gets.
- Verify the pipeline, not just the dashboard. ETL jobs feeding your analytics tool can silently drop events during a platform update, and a flat metric line is sometimes a broken pipeline, not a stalled bot. Reviewing how user behavior data flows into optimization decisions is a useful cross-check when a number looks suspiciously stable.
- Close the loop across teams. Analytics flags the problem, ops reviews the conversation transcripts behind it, and engineering ships the fix. Skipping any one of those three steps is how the same fallback spike reappears every quarter.
How Monobot Turns These Metrics Into a Working Dashboard
Every metric covered above needs a home, and that’s exactly what an advanced analytics layer is built for. Its interaction dashboards can track containment, GCR, fallback rate, and CSAT side by side, segmented by channel and intent rather than blended into a single number that hides where the problems actually live.
A few features map directly onto the KPI groups discussed here:
- Real-time analytics that surface fallback and escalation trends as they happen, not after a weekly export
- Non-coding customization for adjusting confidence thresholds and intent flows without waiting on development cycles
- Real-time agent assist to help close the CSAT gap between bot and human handoffs by passing conversation context on takeover
- Industry-specific templates pre-built with typical intent structures for various use cases
For a deeper look at how CSAT benchmarks apply specifically to chatbot deployments, the Monobot guide to improving CSAT scores walks through the same quality thresholds in more detail.
Why Knowledge Health Should Lead Every KPI Program
Most teams build their first chatbot dashboard around containment, because it’s the easiest number to show a budget owner. That’s a mistake. Containment tells you the bot is busy. It says nothing about whether the bot understands what it’s doing.
Intent accuracy and fallback rate are the metrics that actually protect your CSAT and your ROI math over time, because they catch knowledge gaps before those gaps show up as angry customers. A bot with rising containment and falling intent accuracy isn’t improving. It’s getting better at ending conversations it doesn’t understand, and that pattern is more common than most quarterly reports admit.
Resist the temptation to optimize a single number in isolation. Run small experiments, watch the leading indicators weekly, and get your engineering, ops, and analytics teams looking at the same dashboard instead of three different exports. The KPI suite matters less than the habit of checking knowledge health before you celebrate an efficiency win.
— Alex
Put These Metrics on One Dashboard With Monobot
Monobot is the direct route to everything covered above: a platform where containment, GCR, fallback rate, and CSAT live on one screen instead of three disconnected exports. The Dashboard Insights product tracks the exact metric categories this guide walks through, segmented by channel and intent out of the box, so you’re not building pivot tables to find where fallback rate is spiking.
Pair that with the AI agent builder, which lets you adjust confidence thresholds, retrain intents, and test new flows without a development queue standing between a metric moving and a fix shipping. Whether you’re standardizing measurement for a retail bot or an internal IT helpdesk, the same dashboard structure applies. Request a demo to see your own conversation data mapped against the containment, CSAT, and intent-accuracy benchmarks covered in this guide.
Sources
Benchmark figures and formulas above draw on Netguru’s chatbot KPI research, Jotform’s chatbot analytics guide, Zoho SalesIQ’s metric groupings, and arXiv’s LLM evaluation research for AI-specific quality caveats.
FAQ
What Are the Most Important Chatbot Analytics Metrics?
Containment rate, goal completion rate, CSAT, intent accuracy, escalation rate, and cost per conversation form the core set most teams should track first, since they cover efficiency, quality, and knowledge health together.
What Causes a Chatbot’s CSAT to Fall Below Live-Agent CSAT?
A gap of more than 15 points is most often caused by broken escalation routing, where conversation context fails to transfer to the human agent, rather than a pure language-understanding problem.
How Do You Calculate Chatbot ROI?
Multiply deflected conversations by the average cost per human interaction, then subtract the bot’s operating cost, to get a monthly net savings figure that’s more persuasive to finance stakeholders than a raw automation percentage.
How Often Should You Review Chatbot Analytics?
Leading indicators like fallback rate and intent accuracy should be reviewed weekly, while lagging indicators like CSAT and conversion rate are typically reviewed monthly against the same dashboard, such as Monobot’s interaction dashboards.